Если у Вас установлен Zabbix агент, то общаться мы будем с ОС через него.
При просмотра шаблона Template OS Windows обращаем внимание на элемент данных: Average disk write queue length perf_counter[\234(_Total)\1404].
Что же означают эти цифры \234(_Total)\1404. ?
В ОС Windows эти цифры обозначают внутренние идентификаторы счетчиков производительности. Но если у Вас установленна база Zabbix с кодировкой UTF8, то ничего не мешает нам использовать русские названия в счетчиках
Получаем счетчики следующим образом: typeperf -q
А если у нас несколько жестких дисков (интерфейсов и т.п.): typeperf -qx
Слишком много информации? Фильтруем: typeperf «\Физический диск(_Total)\»
Другой вариант получить счетчики: lodctr /s:perfcount.txt Открыв файл мы увидем идентификаторы и их название в начале на английском, а затем на русском языке.
Практика SNMP
Но что делать, когда нельзя (или нет желания) установить агент? Для этого, мы будем читать счетчики через SNMP:
snmpwalk -Of -c public -v 2c 192.168.0.1
Если выполнять под ОС Windows, то результат будет вида: .iso.3.6.1.2.1.1.1.0 = STRING: «Hardware: Intel64 Family 6 Model 44 Stepping 2 AT/AT COMPATIBLE — Software: Windows Version 6.1 (Build 7601 Multiprocessor Free)»
Если выполнять под ОС Linux, то результат будет вида: .iso.org.dod.internet.mgmt.mib-2.system.sysDescr.0 = STRING: Hardware: Intel64 Family 6 Model 44 Stepping 2 AT/AT COMPATIBLE — Software: Windows Version 6.1 (Build 7601 Multiprocessor Free)
(Также можно поискать соответствие цифр с названиями на http://support.ipmonitor.com/snmp_center.aspx)
Linux вариант более информативный.
Заключение
Осталось подключить необходмые счетки и можно будет следить за производительностью системы.
Мониторинг производительности дисковой подсистемы при помощи zabbix и block stat
Вряд ли кто-то будет спорить, что наблюдение за производительностью дисковой подсистемы — чуть ли не важнейшая задача для всех высоконагруженных систем хранения и баз данных. Я изначально столкнулся с этим давным-давно, еще когда приходилось наблюдать за PostgreSQL. В последнее время вернулся к этому вопросу в связи с необходимостью тестирования различных хранилищ.
Сегодня хочу поделиться с сообществом своим текущим опытом на реальном примере zabbix и его связке с block stat.
Небольшое отступление
Я являюсь архитектором баз данных и систем хранения очень высокой производительности и больших объемов. Поэтому часто сталкиваюсь с задачами оценки, как те или иные параметры настройки системы влияют на работу СХД, какие железные конфигурации СХД лучше.
Да есть куча утилит, которая позволит протестировать диски, например тот же fio. Но ничто не сравнится с тестированием реальной нагрузкой.
Однако прежде чем подавать реальную и настоящую нагрузку, неплохо бы сначала протестировать на синтетике. А наблюдать за синтетикой лучше теми же средствами, что и за боевой системой, просто потому, что даже если ваши метрики не совсем верны методологически – они будут хотя бы те же самые и по ним можно будет делать выводы лучше/хуже.
Когда то давным-давно для этих целей использовал iostat, лютый парсер к нему и gnuplot, и даже написал статейку habr.com/post/165855. Скажу я вам – это жутко неудобно.
Куда как удобнее натравить на систему zabbix и мониторить. А к zabbix можно прикрутить модную Grafana и мониторить красиво. Сразу скажу – выбор zabbix скорее исторический: «потому что он уже был».
Мониторинг дисков в zabbix
Справедливости ради скажу, что в zabbix уже есть встроенные ключи vfs.dev.*, но увы очень мало: скорость чтения и записи, объем.
А что нужно нам?
Практика показывает что ключевые метрики по которым можно оценивать дисковую подсистему это:
Количество операций в секунду (ops)
Пропускная способность (throughput)
Время обработки запроса (latency или правильней svctime)
Утилизация дисковой подсистемы (utilization)
Так как эти метрики очень зависят друг от друга, то не зная все нельзя сделать правильные выводы.
Все эти метрики есть в iostat. Но как их положить в zabbix?
Легкое гугление приводит нас к различным парсерам iostat, в том числе и здесь.
Но мне по душе другой вариант, а именно парсинг вывода /sys/class/block/*/stat
это первоисточник данных — iostat так же использует эти данные
для разбора показателей можно ограничиться только однострочником в UserParameter без дополнительных скриптов.
Но есть и недостатки:
Некоторые параметры необходимо вычислять делением дельты одного на дельту другого, причем не простой, а временной (скорости). В zabbix это сделать можно, но это будут не одновременные запросы, как если бы это делал сложный скрипт, а отношение последних значений, что в принципе не совсем верно, но в нашем случае довольно точно.
Итак, кроме самого zabbix и zabbix-agent на наблюдаемой машине нам потребуется awk. Мы используем дистрибутив CentOS 7.4 и zabbix 3.4
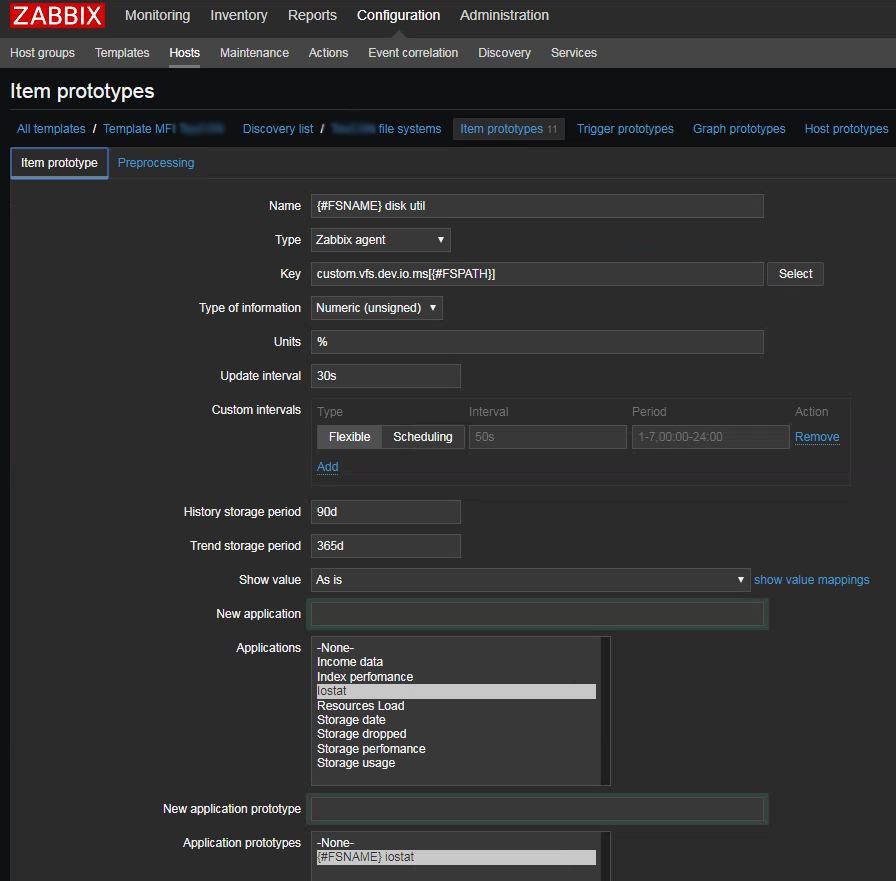
Данные в zabbix мы будем собирать при помощи zabbix-agent, создав пользовательские ключи. Для этого в /etc/zabbix/zabbix_agentd.d нужно создать файлик userparameter_custom.vfs.conf примерно со следующим содержимым:
Тут все просто — создаем пользовательский ключ custom.vfs.dev.io.ms, в качестве параметра передаем туда имя блочного устройства, значением параметра будет 10 колонка файлика stat.
В этом файлике статистики всего 11 колонок, посмотреть их описание можно вот тут.
Колонка №10 это io_tics — количество миллисекунд затраченным устройством на ввод вывод. Как почти все параметры — эта цифра является аккумулятором и постоянно возрастает. Как же получить из них привычные метрики.
Утилизация дисковой подсистемы
Эта метрика аналогична значению поля utils команды iostat -x. Характеризует загрузку дисковой подсистемы. По сути это сколько процентов реального времени система затратила на операции ввода-вывода за интервал между опросами. Как правило при приближении к 100% система начинает все больше простаивать в ожидании когда диски обработают ваши запросы.
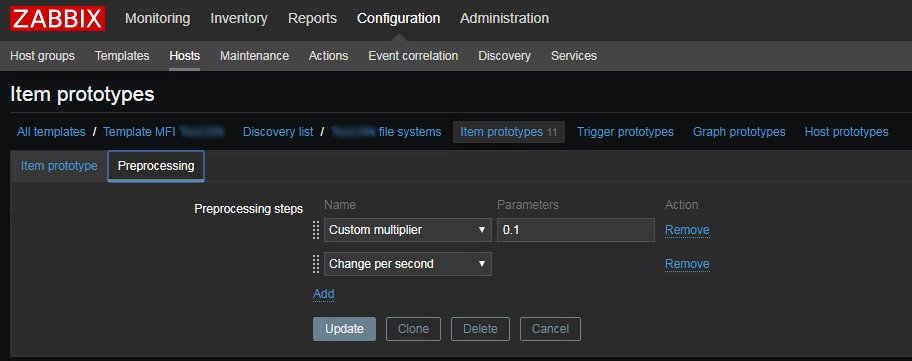
Чтобы получить эту цифру — надо взять значение 10 колонки файла статистики и запомнить его в zabbix как скорость изменения в секунду, не забыв умножить на 0.1 так как значение в статистике в миллисекундах, а нам нужны проценты.
Аналогичным образом можно посчитать нагрузку записью/чтением (колонки write_ticks / read_ticks).
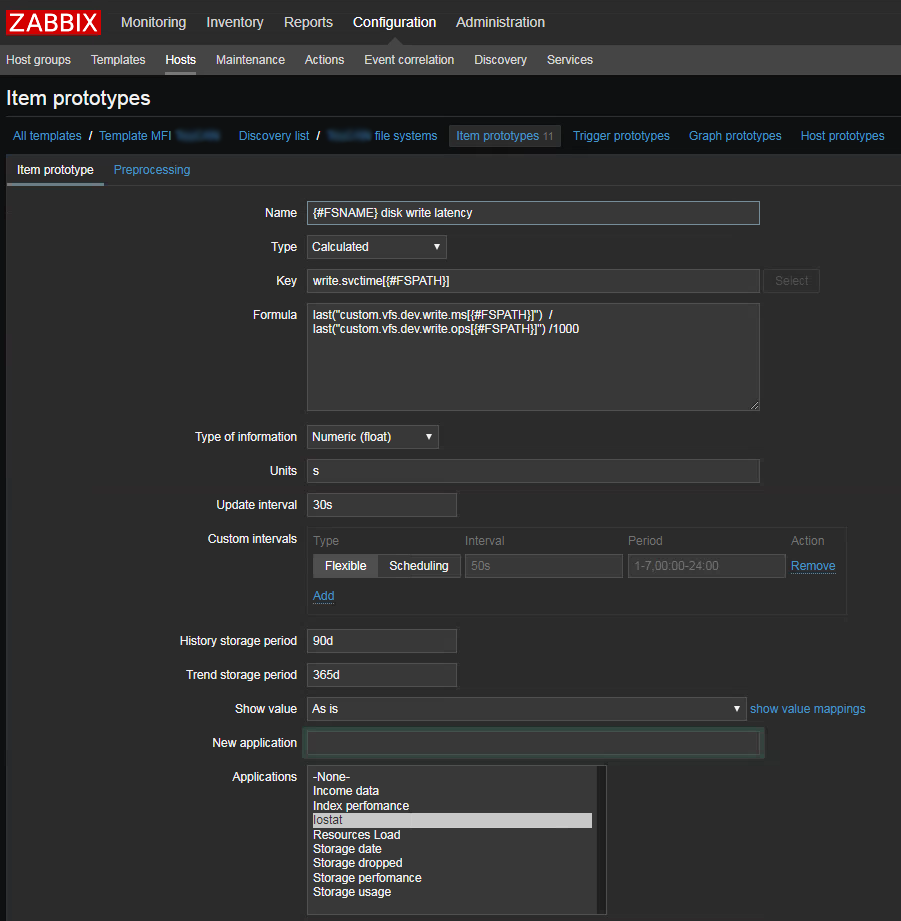
Время обработки запроса
Эта метрика аналогична r_svctime и w_svctime для записи и чтения соответственно. По сути это усредненное время обработки запросов за интервал между опросами.
Данная метрика чуть посложнее. Рассмотрим на примере запросов на запись.
Для этого нам понадобится создать три ключа:
write utils — количество времени потраченное на запись — колонка №8 write_ticks сохраненная, как скорость изменения в секунду между опросами. По сути значение ключа в zabbix будет утилизация записью.
write ops — количество запросов на запись — колонка №5 write I/Os. Так же сохраняем как скорость
svctime или latency — искомый параметр. Создаем как вычисляемое значение: последнее значение write utils / последнее значение write ops. Плюс еще поделить на 1000 чтобы в секунды перейти
Абсолютно также считается время обработки запросов на чтение, только используя колонки №1 read I/Os и №4 read_ticks.
Пропускная способность
Метрика показывающая с какой скоростью данные были записаны или прочитаны
Для этой метрики используются колонки №3 read sectors и №5 write sectors. Значение сколько было прочитано или записано «секторов». Точно так же в zabbix сохраняем как изменение за секунду.
Единственный ньюанс — значение в файле указанно «в попугаях-секторах», причем размер этого «сектора» фиксирован 512 байт и не зависит от реальных значений ни физического ни логического сектора устройства (проверял на нескольких устройствах с реальным размером физического сектора 4к). Так что чтобы пересчитать в байты — не забудьте умножить на 512.
Количество операций ввода-вывода в секунду
Эта метрика — те самые пресловутые IOPS
Самая простая метрика — мы ее уже записывали для подсчета svc time это значение колонок №5 write I/Os и №1 read I/Os также сохраненные как скорость в секунду.
Заключение
Этих метрик мне как правило достаточно для того чтобы я мог делать обоснованные выводы. Конечно это не все цифры которые можно получить из файла статистики. Например там есть и число текущих обрабатываемых запросов, и количество запросов которые были объеденены. Но полагаю при необходимости вам не составит труда добавить их по аналогии с описанным. И да не претендую на авторство — сам метод был когда-то давно загуглен, но за давностью лет ссылки конечно затерялись.
Увы NDA заставляет кое-что подчистить из них, но надеюсь на работоспособность шаблона это не повлияет.
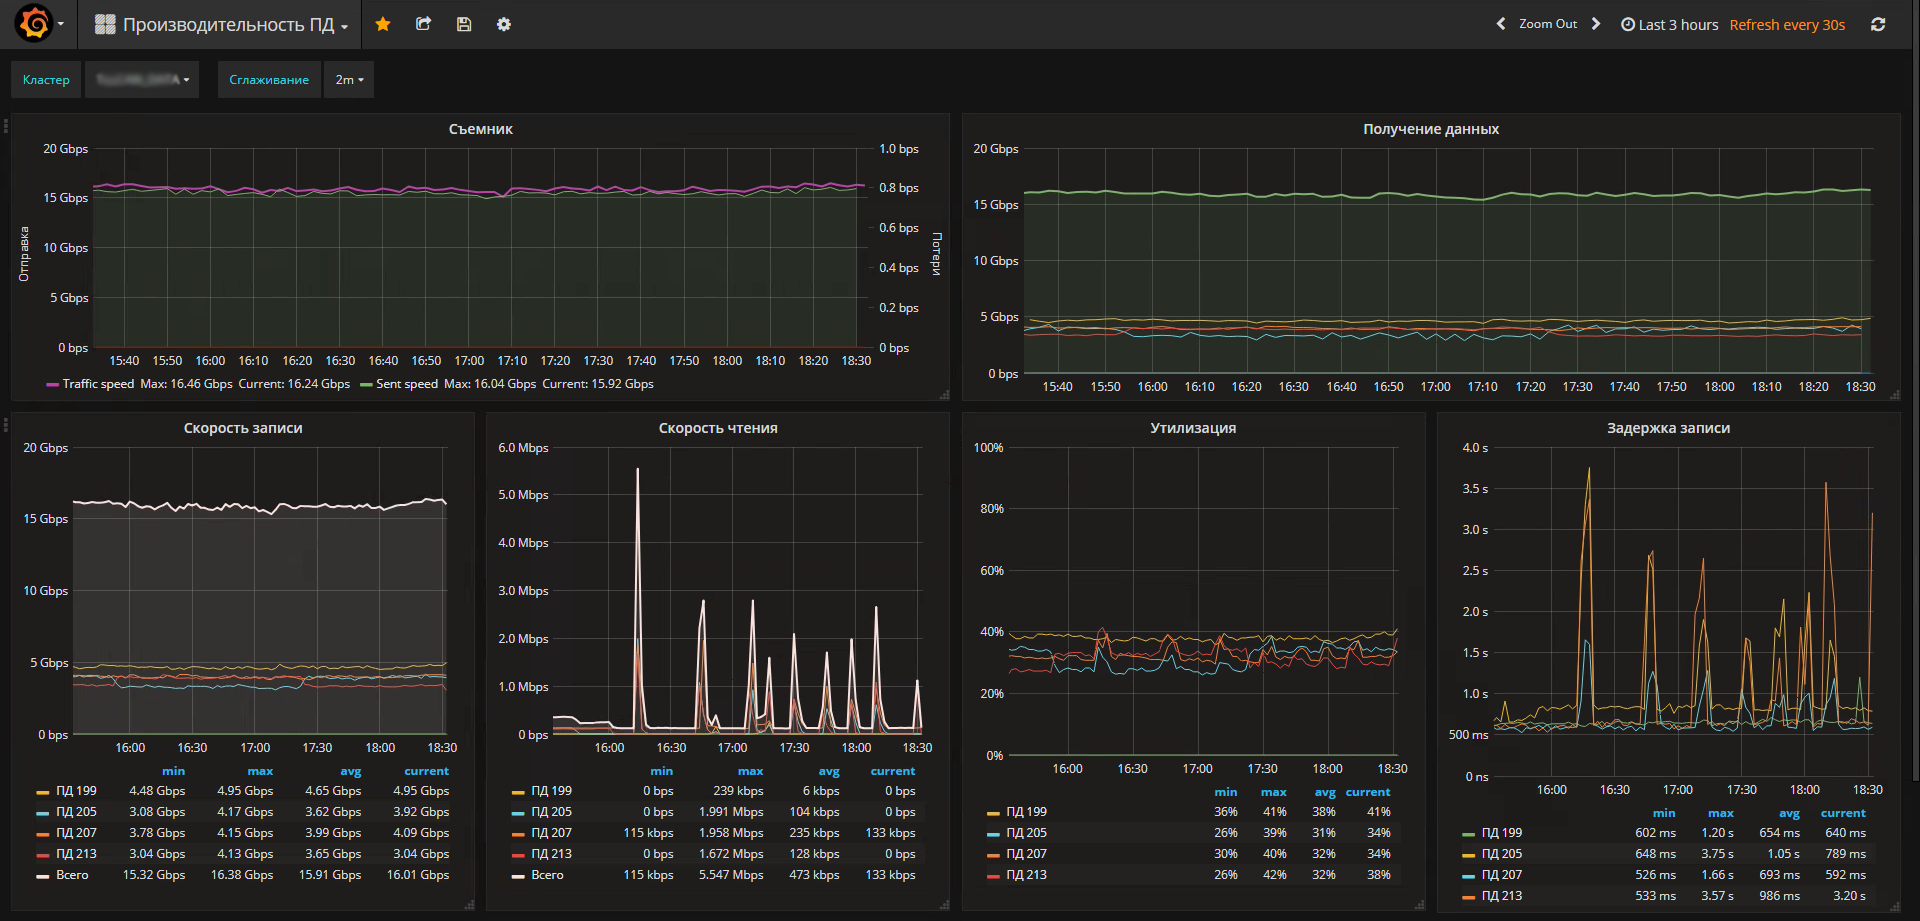
А в шапке скриншот из Grafana прикрученной поверх zabbix — демонстрирующий реальные цифры с одной из тестовых инсталляций.
Zabbix + Windows
Windows
Microsoft Windows is a group of several graphical operating system families, all of which are developed, marketed, and sold by Microsoft.
Available solutions
Windows CPU by Zabbix agent
Overview
For Zabbix version: 5.4 and higher
Setup
Refer to the vendor documentation.
Zabbix configuration
No specific Zabbix configuration is required.
Macros used
The critical threshold of the % Interrupt Time counter.
The threshold of the % Privileged Time counter.
The threshold of the Processor Queue Length counter.
The critical threshold of the CPU utilization in %.
Template links
There are no template links in this template.
Discovery rules
Items collected
Group
Name
Description
Type
Key and additional info
CPU
CPU utilization
CPU utilization in %
ZABBIX_PASSIVE
system.cpu.util
CPU
CPU interrupt time
The Processor Information\% Interrupt Time is the time the processor spends receiving and servicing
hardware interrupts during sample intervals. This value is an indirect indicator of the activity of
devices that generate interrupts, such as the system clock, the mouse, disk drivers, data communication
lines, network interface cards and other peripheral devices. This is an easy way to identify a potential
hardware failure. This should never be higher than 20%.
Context Switches/sec is the combined rate at which all processors on the computer are switched from one thread to another.
Context switches occur when a running thread voluntarily relinquishes the processor, is preempted by a higher priority ready thread, or switches between user-mode and privileged (kernel) mode to use an Executive or subsystem service.
It is the sum of Thread\Context Switches/sec for all threads running on all processors in the computer and is measured in numbers of switches.
There are context switch counters on the System and Thread objects. This counter displays the difference between the values observed in the last two samples, divided by the duration of the sample interval.
ZABBIX_PASSIVE
perf_counter_en[«\System\Context Switches/sec»]
CPU
CPU privileged time
The Processor Information\% Privileged Time counter shows the percent of time that the processor is spent
executing in Kernel (or Privileged) mode. Privileged mode includes services interrupts inside Interrupt
Service Routines (ISRs), executing Deferred Procedure Calls (DPCs), Device Driver calls and other kernel-mode
The Processor Information\% User Time counter shows the percent of time that the processor(s) is spent executing
ZABBIX_PASSIVE
perf_counter_en[«\Processor Information(_total)\% User Time»]
CPU
Number of cores
The number of logical processors available on the computer.
ZABBIX_PASSIVE
wmi.get[root/cimv2,»Select NumberOfLogicalProcessors from Win32_ComputerSystem»]
CPU
CPU queue length
The Processor Queue Length shows the number of threads that are observed as delayed in the processor Ready Queue
and are waiting to be executed.
ZABBIX_PASSIVE
perf_counter_en[«\System\Processor Queue Length»]
Triggers
Name
Description
Expression
Severity
Dependencies and additional info
High CPU utilization (over <$CPU.UTIL.CRIT>% for 5m)
CPU utilization is too high. The system might be slow to respond.
>
WARNING
CPU interrupt time is too high (over <$CPU.INTERRUPT.CRIT.MAX>% for 5m)
«The CPU Interrupt Time in the last 5 minutes exceeds <$CPU.INTERRUPT.CRIT.MAX>%.»
The Processor Information\% Interrupt Time is the time the processor spends receiving and servicing
hardware interrupts during sample intervals. This value is an indirect indicator of the activity of
devices that generate interrupts, such as the system clock, the mouse, disk drivers, data communication
lines, network interface cards and other peripheral devices. This is an easy way to identify a potential
hardware failure. This should never be higher than 20%.
Depends on:
— High CPU utilization (over <$CPU.UTIL.CRIT>% for 5m)
CPU privileged time is too high (over <$CPU.PRIV.CRIT.MAX>% for 5m)
The CPU privileged time in the last 5 minutes exceeds <$CPU.PRIV.CRIT.MAX>%.
Depends on:
— CPU interrupt time is too high (over <$CPU.INTERRUPT.CRIT.MAX>% for 5m)
— High CPU utilization (over <$CPU.UTIL.CRIT>% for 5m)
CPU queue length is too high (over <$CPU.QUEUE.CRIT.MAX>for 5m)
The CPU Queue Length in the last 5 minutes exceeds <$CPU.QUEUE.CRIT.MAX>. According to actual observations, PQL should not exceed the number of cores * 2. To fine-tune the conditions, use the macro <$CPU.QUEUE.CRIT.MAX >.
Depends on:
— High CPU utilization (over <$CPU.UTIL.CRIT>% for 5m)
Feedback
Please report any issues with the template at https://support.zabbix.com
Windows memory by Zabbix agent
Overview
For Zabbix version: 5.4 and higher
Setup
Refer to the vendor documentation.
Zabbix configuration
No specific Zabbix configuration is required.
Macros used
The warning threshold of the Memory Pages/sec counter.
The warning threshold of the Free System Page Table Entries counter.
This indicates the number of page table entries not currently in use by the system. If the number is less
than 5,000, there may well be a memory leak or you running out of memory.
ZABBIX_PASSIVE
perf_counter_en[«\Memory\Free System Page Table Entries»]
Memory
Memory page faults per second
Page Faults/sec is the average number of pages faulted per second. It is measured in number of pages
faulted per second because only one page is faulted in each fault operation, hence this is also equal
to the number of page fault operations. This counter includes both hard faults (those that require
disk access) and soft faults (where the faulted page is found elsewhere in physical memory.) Most
processors can handle large numbers of soft faults without significant consequence. However, hard faults,
which require disk access, can cause significant delays.
ZABBIX_PASSIVE
perf_counter_en[«\Memory\Page Faults/sec»]
Memory
Memory pages per second
This measures the rate at which pages are read from or written to disk to resolve hard page faults.
If the value is greater than 1,000, as a result of excessive paging, there may be a memory leak.
ZABBIX_PASSIVE
perf_counter_en[«\Memory\Pages/sec»]
Memory
Memory pool non-paged
This measures the size, in bytes, of the non-paged pool. This is an area of system memory for objects
that cannot be written to disk but instead must remain in physical memory as long as they are allocated.
There is a possible memory leak if the value is greater than 175MB (or 100MB with the /3GB switch).
A typical Event ID 2019 is recorded in the system event log.
ZABBIX_PASSIVE
perf_counter_en[«\Memory\Pool Nonpaged Bytes»]
Triggers
Name
Description
Expression
Severity
Dependencies and additional info
High memory utilization (><$MEMORY.UTIL.MAX>% for 5m)
The system is running out of free memory.
>
AVERAGE
High swap space usage (less than <$SWAP.PFREE.MIN.WARN>% free)
This trigger is ignored, if there is no swap configured
Depends on:
— High memory utilization (><$MEMORY.UTIL.MAX>% for 5m)
Number of free system page table entries is too low (less <$MEM.PAGE_TABLE_CRIT.MIN>for 5m)
The Memory Free System Page Table Entries is less than <$MEM.PAGE_TABLE_CRIT.MIN>for 5 minutes. If the number is less than 5,000, there may well be a memory leak.
Depends on:
— High memory utilization (><$MEMORY.UTIL.MAX>% for 5m)
The Memory Pages/sec is too high (over <$MEM.PAGE_SEC.CRIT.MAX>for 5m)
The Memory Pages/sec in the last 5 minutes exceeds <$MEM.PAGE_SEC.CRIT.MAX>. If the value is greater than 1,000, as a result of excessive paging, there may be a memory leak.
Depends on:
— High memory utilization (><$MEMORY.UTIL.MAX>% for 5m)
Feedback
Please report any issues with the template at https://support.zabbix.com
Windows filesystems by Zabbix agent
Overview
For Zabbix version: 5.4 and higher
Setup
Refer to the vendor documentation.
Zabbix configuration
No specific Zabbix configuration is required.
Macros used
This macro is used in filesystems discovery. Can be overridden on the host or linked template level.
This macro is used in filesystems discovery. Can be overridden on the host or linked template level.
This macro is used in filesystems discovery. Can be overridden on the host or linked template level.
This macro is used in filesystems discovery. Can be overridden on the host or linked template level.
This macro is used in filesystems discovery. Can be overridden on the host or linked template level.
This macro is used in filesystems discovery. Can be overridden on the host or linked template level.
The critical threshold of the filesystem utilization in percent.
The warning threshold of the filesystem utilization in percent.
Template links
There are no template links in this template.
Discovery rules
Name
Description
Type
Key and additional info
Mounted filesystem discovery
Discovery of file systems of different types.
ZABBIX_PASSIVE
vfs.fs.discovery
Filter:
Items collected
Group
Name
Description
Type
Key and additional info
Filesystems
<#FSNAME>: Used space
Used storage in Bytes
ZABBIX_PASSIVE
vfs.fs.size[<#FSNAME>,used]
Filesystems
<#FSNAME>: Total space
Total space in Bytes
ZABBIX_PASSIVE
vfs.fs.size[<#FSNAME>,total]
Filesystems
<#FSNAME>: Space utilization
Space utilization in % for
ZABBIX_PASSIVE
vfs.fs.size[<#FSNAME>,pused]
Triggers
Name
Description
Expression
Severity
Dependencies and additional info
<#FSNAME>: Disk space is critically low (used > <$VFS.FS.PUSED.MAX.CRIT:"<#FSNAME>«>%)
Two conditions should match: First, space utilization should be above <$VFS.FS.PUSED.MAX.CRIT:"<#FSNAME>«>.
Second condition should be one of the following:
— The disk free space is less than 5G.
— The disk will be full in less than 24 hours.
,pused].last()>><$VFS.FS.PUSED.MAX.CRIT:"<#FSNAME>«> and ((,total].last()>-,used].last()>)
AVERAGE
Manual close: YES
Two conditions should match: First, space utilization should be above <$VFS.FS.PUSED.MAX.WARN:"<#FSNAME>«>.
Second condition should be one of the following:
— The disk free space is less than 10G.
— The disk will be full in less than 24 hours.
,pused].last()>><$VFS.FS.PUSED.MAX.WARN:"<#FSNAME>«> and ((,total].last()>-,used].last()>)
WARNING
Manual close: YES
Depends on:
Feedback
Please report any issues with the template at https://support.zabbix.com
Windows physical disks by Zabbix agent
Overview
For Zabbix version: 5.4 and higher
Setup
Refer to the vendor documentation.
Zabbix configuration
No specific Zabbix configuration is required.
Macros used
This macro is used in physical disks discovery. Can be overridden on the host or linked template level.
This macro is used in physical disks discovery. Can be overridden on the host or linked template level.
Disk read average response time (in s) before the trigger would fire.
The warning threshold of disk time utilization in percent.
Disk write average response time (in s) before the trigger would fire.
Current average disk queue, the number of requests outstanding on the disk at the time the performance data is collected.
ZABBIX_PASSIVE
perf_counter_en[«\PhysicalDisk(<#DEVNAME>)\Current Disk Queue Length»,60]
Storage
<#DEVNAME>: Disk utilization
This item is the percentage of elapsed time that the selected disk drive was busy servicing read or writes requests.
ZABBIX_PASSIVE
perf_counter_en[«\PhysicalDisk(<#DEVNAME>)\% Disk Time»,60]
Storage
<#DEVNAME>: Disk read request avg waiting time
The average time for read requests issued to the device to be served. This includes the time spent by the requests in queue and the time spent servicing them.
ZABBIX_PASSIVE
perf_counter_en[«\PhysicalDisk(<#DEVNAME>)\Avg. Disk sec/Read»,60]
Storage
<#DEVNAME>: Disk write request avg waiting time
The average time for write requests issued to the device to be served. This includes the time spent by the requests in queue and the time spent servicing them.
ZABBIX_PASSIVE
perf_counter_en[«\PhysicalDisk(<#DEVNAME>)\Avg. Disk sec/Write»,60]
Storage
<#DEVNAME>: Average disk read queue length
Average disk read queue, the number of requests outstanding on the disk at the time the performance data is collected.
ZABBIX_PASSIVE
perf_counter_en[«\PhysicalDisk(<#DEVNAME>)\Avg. Disk Read Queue Length»,60]
Storage
<#DEVNAME>: Average disk write queue length
Average disk write queue, the number of requests outstanding on the disk at the time the performance data is collected.
ZABBIX_PASSIVE
perf_counter_en[«\PhysicalDisk(<#DEVNAME>)\Avg. Disk Write Queue Length»,60]
Triggers
Name
Description
Expression
Severity
Dependencies and additional info
<#DEVNAME>: Disk is overloaded (util > <$VFS.DEV.UTIL.MAX.WARN>% for 15m)
The disk appears to be under heavy load
Manual close: YES
Depends on:
— <#DEVNAME>: Disk read request responses are too high (read > <$VFS.DEV.READ.AWAIT.WARN:"<#DEVNAME>«>s for 15m
— <#DEVNAME>: Disk write request responses are too high (write > <$VFS.DEV.WRITE.AWAIT.WARN:"<#DEVNAME>«>s for 15m)
<#DEVNAME>: Disk read request responses are too high (read > <$VFS.DEV.READ.AWAIT.WARN:"<#DEVNAME>«>s for 15m
This trigger might indicate disk <#DEVNAME>saturation.
)\Avg. Disk sec/Read»,60].min(15m)> > <$VFS.DEV.READ.AWAIT.WARN:"<#DEVNAME>«>
WARNING
Manual close: YES
<#DEVNAME>: Disk write request responses are too high (write > <$VFS.DEV.WRITE.AWAIT.WARN:"<#DEVNAME>«>s for 15m)
This trigger might indicate disk <#DEVNAME>saturation.
)\Avg. Disk sec/Write»,60].min(15m)> > <$VFS.DEV.WRITE.AWAIT.WARN:"<#DEVNAME>«>
WARNING
Manual close: YES
Feedback
Please report any issues with the template at https://support.zabbix.com
Windows generic by Zabbix agent
Overview
For Zabbix version: 5.4 and higher
Setup
Refer to the vendor documentation.
Zabbix configuration
No specific Zabbix configuration is required.
Macros used
The threshold for difference of system time in seconds.
Template links
There are no template links in this template.
Discovery rules
Items collected
Group
Name
Description
Type
Key and additional info
General
System local time
System local time of the host.
ZABBIX_PASSIVE
system.localtime
General
System name
System host name.
ZABBIX_PASSIVE
system.hostname
Preprocessing:
System description of the host.
ZABBIX_PASSIVE
system.uname
Preprocessing:
The number of processes.
ZABBIX_PASSIVE
proc.num[]
General
Number of threads
The number of threads used by all running processes.
ZABBIX_PASSIVE
perf_counter_en[«\System\Threads»]
Inventory
Operating system architecture
Operating system architecture of the host.
ZABBIX_PASSIVE
system.sw.arch
Preprocessing:
System uptime in ‘N days, hh:mm:ss’ format.
ZABBIX_PASSIVE
system.uptime
Triggers
Name
Description
Expression
Severity
Dependencies and additional info
System time is out of sync (diff with Zabbix server > <$SYSTEM.FUZZYTIME.MAX>s)
The host system time is different from the Zabbix server time.
Manual close: YES
System name has changed (new name: )
System name has changed. Ack to close.
Manual close: YES
Host has been restarted (uptime
WARNING
Manual close: YES
Feedback
Please report any issues with the template at https://support.zabbix.com
Windows network by Zabbix agent
Overview
For Zabbix version: 5.4 and higher
Setup
Refer to the vendor documentation.
Zabbix configuration
No specific Zabbix configuration is required.
Macros used
This macro is used in Network interface discovery. Can be overridden on the host or linked template level.
This macro is used in Network interface discovery. Can be overridden on the host or linked template level.
This macro is used in Network interface discovery. Can be overridden on the host or linked template level.
This macro is used in Network interface discovery. Can be overridden on the host or linked template level.
This macro is used in Network interface discovery. Can be overridden on the host or linked template level.
This macro is used in Network interface discovery. Can be overridden on the host or linked template level.
wmi.getall[root\cimv2,»select Name,Description,NetConnectionID,Speed,AdapterTypeId,NetConnectionStatus from win32_networkadapter where PhysicalAdapter=True and NetConnectionStatus>0″]
Triggers
Name
Description
Expression
Severity
Dependencies and additional info
Interface <#IFNAME>(<#IFALIAS>): High bandwidth usage (> <$IF.UTIL.MAX:"<#IFNAME>«>% )
The network interface utilization is close to its estimated maximum bandwidth.
(«].avg(15m)>>(<$IF.UTIL.MAX:"<#IFNAME>«>/100)*«].last()> or «].avg(15m)>>(<$IF.UTIL.MAX:"<#IFNAME>«>/100)*«].last()>) and «].last()>>0
«].avg(15m)>
WARNING
Manual close: YES
Depends on:
Interface <#IFNAME>(<#IFALIAS>): High error rate (> <$IF.ERRORS.WARN:"<#IFNAME>«> for 5m)
Recovers when below 80% of <$IF.ERRORS.WARN:"<#IFNAME>«> threshold
«,errors].min(5m)>><$IF.ERRORS.WARN:"<#IFNAME>«> or «,errors].min(5m)>><$IF.ERRORS.WARN:"<#IFNAME>«>
«,errors].max(5m)>
WARNING
Manual close: YES
Depends on:
Interface <#IFNAME>(<#IFALIAS>): Ethernet has changed to lower speed than it was before
This Ethernet connection has transitioned down from its known maximum speed. This might be a sign of autonegotiation issues. Ack to close.
Manual close: YES
Depends on:
This trigger expression works as follows:
1. Can be triggered if operations status is down.
2. <$IFCONTROL:\"<#IFNAME>\»>=1 — user can redefine Context macro to value — 0. That marks this interface as not important.
No new trigger will be fired if this interface is down.
3. =1) — trigger fires only if operational status is different from Connected(2).
WARNING: if closed manually — won’t fire again on next poll, because of .diff.
<$IFCONTROL:"<#IFNAME>«>=1 and («].last()><>2 and «].diff()>=1)
«].last()>=2 or <$IFCONTROL:"<#IFNAME>«>=0
AVERAGE
Manual close: YES
Feedback
Please report any issues with the template at https://support.zabbix.com
Windows services by Zabbix agent
Overview
For Zabbix version: 5.4 and higher Special version of services template that is required for Windows OS.
Setup
Refer to the vendor documentation.
Zabbix configuration
No specific Zabbix configuration is required.
Macros used
This macro is used in Service discovery. Can be overridden on the host or linked template level.
This macro is used in Service discovery. Can be overridden on the host or linked template level.
Context Switches/sec is the combined rate at which all processors on the computer are switched from one thread to another.
Context switches occur when a running thread voluntarily relinquishes the processor, is preempted by a higher priority ready thread, or switches between user-mode and privileged (kernel) mode to use an Executive or subsystem service.
It is the sum of Thread\Context Switches/sec for all threads running on all processors in the computer and is measured in numbers of switches.
There are context switch counters on the System and Thread objects. This counter displays the difference between the values observed in the last two samples, divided by the duration of the sample interval.
ZABBIX_ACTIVE
perf_counter_en[«\System\Context Switches/sec»]
CPU
CPU privileged time
The Processor Information\% Privileged Time counter shows the percent of time that the processor is spent
executing in Kernel (or Privileged) mode. Privileged mode includes services interrupts inside Interrupt
Service Routines (ISRs), executing Deferred Procedure Calls (DPCs), Device Driver calls and other kernel-mode
The Processor Information\% User Time counter shows the percent of time that the processor(s) is spent executing
ZABBIX_ACTIVE
perf_counter_en[«\Processor Information(_total)\% User Time»]
CPU
Number of cores
The number of logical processors available on the computer.
ZABBIX_ACTIVE
wmi.get[root/cimv2,»Select NumberOfLogicalProcessors from Win32_ComputerSystem»]
CPU
CPU queue length
The Processor Queue Length shows the number of threads that are observed as delayed in the processor Ready Queue
and are waiting to be executed.
ZABBIX_ACTIVE
perf_counter_en[«\System\Processor Queue Length»]
Triggers
Name
Description
Expression
Severity
Dependencies and additional info
High CPU utilization (over <$CPU.UTIL.CRIT>% for 5m)
CPU utilization is too high. The system might be slow to respond.
>
WARNING
CPU interrupt time is too high (over <$CPU.INTERRUPT.CRIT.MAX>% for 5m)
«The CPU Interrupt Time in the last 5 minutes exceeds <$CPU.INTERRUPT.CRIT.MAX>%.»
The Processor Information\% Interrupt Time is the time the processor spends receiving and servicing
hardware interrupts during sample intervals. This value is an indirect indicator of the activity of
devices that generate interrupts, such as the system clock, the mouse, disk drivers, data communication
lines, network interface cards and other peripheral devices. This is an easy way to identify a potential
hardware failure. This should never be higher than 20%.
Depends on:
— High CPU utilization (over <$CPU.UTIL.CRIT>% for 5m)
CPU privileged time is too high (over <$CPU.PRIV.CRIT.MAX>% for 5m)
The CPU privileged time in the last 5 minutes exceeds <$CPU.PRIV.CRIT.MAX>%.
Depends on:
— CPU interrupt time is too high (over <$CPU.INTERRUPT.CRIT.MAX>% for 5m)
— High CPU utilization (over <$CPU.UTIL.CRIT>% for 5m)
CPU queue length is too high (over <$CPU.QUEUE.CRIT.MAX>for 5m)
The CPU Queue Length in the last 5 minutes exceeds <$CPU.QUEUE.CRIT.MAX>. According to actual observations, PQL should not exceed the number of cores * 2. To fine-tune the conditions, use the macro <$CPU.QUEUE.CRIT.MAX >.
Depends on:
— High CPU utilization (over <$CPU.UTIL.CRIT>% for 5m)
Feedback
Please report any issues with the template at https://support.zabbix.com
Windows memory by Zabbix agent active
Overview
For Zabbix version: 5.4 and higher
Setup
Refer to the vendor documentation.
Zabbix configuration
No specific Zabbix configuration is required.
Macros used
The warning threshold of the Memory Pages/sec counter.
The warning threshold of the Free System Page Table Entries counter.
This indicates the number of page table entries not currently in use by the system. If the number is less
than 5,000, there may well be a memory leak or you running out of memory.
ZABBIX_ACTIVE
perf_counter_en[«\Memory\Free System Page Table Entries»]
Memory
Memory page faults per second
Page Faults/sec is the average number of pages faulted per second. It is measured in number of pages
faulted per second because only one page is faulted in each fault operation, hence this is also equal
to the number of page fault operations. This counter includes both hard faults (those that require
disk access) and soft faults (where the faulted page is found elsewhere in physical memory.) Most
processors can handle large numbers of soft faults without significant consequence. However, hard faults,
which require disk access, can cause significant delays.
ZABBIX_ACTIVE
perf_counter_en[«\Memory\Page Faults/sec»]
Memory
Memory pages per second
This measures the rate at which pages are read from or written to disk to resolve hard page faults.
If the value is greater than 1,000, as a result of excessive paging, there may be a memory leak.
ZABBIX_ACTIVE
perf_counter_en[«\Memory\Pages/sec»]
Memory
Memory pool non-paged
This measures the size, in bytes, of the non-paged pool. This is an area of system memory for objects
that cannot be written to disk but instead must remain in physical memory as long as they are allocated.
There is a possible memory leak if the value is greater than 175MB (or 100MB with the /3GB switch).
A typical Event ID 2019 is recorded in the system event log.
ZABBIX_ACTIVE
perf_counter_en[«\Memory\Pool Nonpaged Bytes»]
Triggers
Name
Description
Expression
Severity
Dependencies and additional info
High memory utilization (><$MEMORY.UTIL.MAX>% for 5m)
The system is running out of free memory.
>
AVERAGE
High swap space usage (less than <$SWAP.PFREE.MIN.WARN>% free)
This trigger is ignored, if there is no swap configured
Depends on:
— High memory utilization (><$MEMORY.UTIL.MAX>% for 5m)
Number of free system page table entries is too low (less <$MEM.PAGE_TABLE_CRIT.MIN>for 5m)
The Memory Free System Page Table Entries is less than <$MEM.PAGE_TABLE_CRIT.MIN>for 5 minutes. If the number is less than 5,000, there may well be a memory leak.
Depends on:
— High memory utilization (><$MEMORY.UTIL.MAX>% for 5m)
The Memory Pages/sec is too high (over <$MEM.PAGE_SEC.CRIT.MAX>for 5m)
The Memory Pages/sec in the last 5 minutes exceeds <$MEM.PAGE_SEC.CRIT.MAX>. If the value is greater than 1,000, as a result of excessive paging, there may be a memory leak.
Depends on:
— High memory utilization (><$MEMORY.UTIL.MAX>% for 5m)
Feedback
Please report any issues with the template at https://support.zabbix.com
Windows filesystems by Zabbix agent active
Overview
For Zabbix version: 5.4 and higher
Setup
Refer to the vendor documentation.
Zabbix configuration
No specific Zabbix configuration is required.
Macros used
This macro is used in filesystems discovery. Can be overridden on the host or linked template level.
This macro is used in filesystems discovery. Can be overridden on the host or linked template level.
This macro is used in filesystems discovery. Can be overridden on the host or linked template level.
This macro is used in filesystems discovery. Can be overridden on the host or linked template level.
This macro is used in filesystems discovery. Can be overridden on the host or linked template level.
This macro is used in filesystems discovery. Can be overridden on the host or linked template level.
The critical threshold of the filesystem utilization in percent.
The warning threshold of the filesystem utilization in percent.
Template links
There are no template links in this template.
Discovery rules
Name
Description
Type
Key and additional info
Mounted filesystem discovery
Discovery of file systems of different types.
ZABBIX_ACTIVE
vfs.fs.discovery
Filter:
Items collected
Group
Name
Description
Type
Key and additional info
Filesystems
<#FSNAME>: Used space
Used storage in Bytes
ZABBIX_ACTIVE
vfs.fs.size[<#FSNAME>,used]
Filesystems
<#FSNAME>: Total space
Total space in Bytes
ZABBIX_ACTIVE
vfs.fs.size[<#FSNAME>,total]
Filesystems
<#FSNAME>: Space utilization
Space utilization in % for
ZABBIX_ACTIVE
vfs.fs.size[<#FSNAME>,pused]
Triggers
Name
Description
Expression
Severity
Dependencies and additional info
<#FSNAME>: Disk space is critically low (used > <$VFS.FS.PUSED.MAX.CRIT:"<#FSNAME>«>%)
Two conditions should match: First, space utilization should be above <$VFS.FS.PUSED.MAX.CRIT:"<#FSNAME>«>.
Second condition should be one of the following:
— The disk free space is less than 5G.
— The disk will be full in less than 24 hours.
,pused].last()>><$VFS.FS.PUSED.MAX.CRIT:"<#FSNAME>«> and ((,total].last()>-,used].last()>)
AVERAGE
Manual close: YES
Two conditions should match: First, space utilization should be above <$VFS.FS.PUSED.MAX.WARN:"<#FSNAME>«>.
Second condition should be one of the following:
— The disk free space is less than 10G.
— The disk will be full in less than 24 hours.
,pused].last()>><$VFS.FS.PUSED.MAX.WARN:"<#FSNAME>«> and ((,total].last()>-,used].last()>)
WARNING
Manual close: YES
Depends on:
Feedback
Please report any issues with the template at https://support.zabbix.com
Windows physical disks by Zabbix agent active
Overview
For Zabbix version: 5.4 and higher
Setup
Refer to the vendor documentation.
Zabbix configuration
No specific Zabbix configuration is required.
Macros used
This macro is used in physical disks discovery. Can be overridden on the host or linked template level.
This macro is used in physical disks discovery. Can be overridden on the host or linked template level.
Disk read average response time (in s) before the trigger would fire.
The warning threshold of disk time utilization in percent.
Disk write average response time (in s) before the trigger would fire.
Current average disk queue, the number of requests outstanding on the disk at the time the performance data is collected.
ZABBIX_ACTIVE
perf_counter_en[«\PhysicalDisk(<#DEVNAME>)\Current Disk Queue Length»,60]
Storage
<#DEVNAME>: Disk utilization
This item is the percentage of elapsed time that the selected disk drive was busy servicing read or writes requests.
ZABBIX_ACTIVE
perf_counter_en[«\PhysicalDisk(<#DEVNAME>)\% Disk Time»,60]
Storage
<#DEVNAME>: Disk read request avg waiting time
The average time for read requests issued to the device to be served. This includes the time spent by the requests in queue and the time spent servicing them.
ZABBIX_ACTIVE
perf_counter_en[«\PhysicalDisk(<#DEVNAME>)\Avg. Disk sec/Read»,60]
Storage
<#DEVNAME>: Disk write request avg waiting time
The average time for write requests issued to the device to be served. This includes the time spent by the requests in queue and the time spent servicing them.
ZABBIX_ACTIVE
perf_counter_en[«\PhysicalDisk(<#DEVNAME>)\Avg. Disk sec/Write»,60]
Storage
<#DEVNAME>: Average disk read queue length
Average disk read queue, the number of requests outstanding on the disk at the time the performance data is collected.
ZABBIX_ACTIVE
perf_counter_en[«\PhysicalDisk(<#DEVNAME>)\Avg. Disk Read Queue Length»,60]
Storage
<#DEVNAME>: Average disk write queue length
Average disk write queue, the number of requests outstanding on the disk at the time the performance data is collected.
ZABBIX_ACTIVE
perf_counter_en[«\PhysicalDisk(<#DEVNAME>)\Avg. Disk Write Queue Length»,60]
Triggers
Name
Description
Expression
Severity
Dependencies and additional info
<#DEVNAME>: Disk is overloaded (util > <$VFS.DEV.UTIL.MAX.WARN>% for 15m)
The disk appears to be under heavy load
Manual close: YES
Depends on:
— <#DEVNAME>: Disk read request responses are too high (read > <$VFS.DEV.READ.AWAIT.WARN:"<#DEVNAME>«>s for 15m
— <#DEVNAME>: Disk write request responses are too high (write > <$VFS.DEV.WRITE.AWAIT.WARN:"<#DEVNAME>«>s for 15m)
<#DEVNAME>: Disk read request responses are too high (read > <$VFS.DEV.READ.AWAIT.WARN:"<#DEVNAME>«>s for 15m
This trigger might indicate disk <#DEVNAME>saturation.
)\Avg. Disk sec/Read»,60].min(15m)> > <$VFS.DEV.READ.AWAIT.WARN:"<#DEVNAME>«>
WARNING
Manual close: YES
<#DEVNAME>: Disk write request responses are too high (write > <$VFS.DEV.WRITE.AWAIT.WARN:"<#DEVNAME>«>s for 15m)
This trigger might indicate disk <#DEVNAME>saturation.
)\Avg. Disk sec/Write»,60].min(15m)> > <$VFS.DEV.WRITE.AWAIT.WARN:"<#DEVNAME>«>
WARNING
Manual close: YES
Feedback
Please report any issues with the template at https://support.zabbix.com
Windows generic by Zabbix agent active
Overview
For Zabbix version: 5.4 and higher
Setup
Refer to the vendor documentation.
Zabbix configuration
No specific Zabbix configuration is required.
Macros used
The threshold for difference of system time in seconds.
Template links
There are no template links in this template.
Discovery rules
Items collected
Group
Name
Description
Type
Key and additional info
General
System local time
System local time of the host.
ZABBIX_ACTIVE
system.localtime
General
System name
System host name.
ZABBIX_ACTIVE
system.hostname
Preprocessing:
System description of the host.
ZABBIX_ACTIVE
system.uname
Preprocessing:
The number of processes.
ZABBIX_ACTIVE
proc.num[]
General
Number of threads
The number of threads used by all running processes.
ZABBIX_ACTIVE
perf_counter_en[«\System\Threads»]
Inventory
Operating system architecture
Operating system architecture of the host.
ZABBIX_ACTIVE
system.sw.arch
Preprocessing:
System uptime in ‘N days, hh:mm:ss’ format.
ZABBIX_ACTIVE
system.uptime
Triggers
Name
Description
Expression
Severity
Dependencies and additional info
System time is out of sync (diff with Zabbix server > <$SYSTEM.FUZZYTIME.MAX>s)
The host system time is different from the Zabbix server time.
Manual close: YES
System name has changed (new name: )
System name has changed. Ack to close.
Manual close: YES
Host has been restarted (uptime
WARNING
Manual close: YES
Feedback
Please report any issues with the template at https://support.zabbix.com
Windows network by Zabbix agent active
Overview
For Zabbix version: 5.4 and higher
Setup
Refer to the vendor documentation.
Zabbix configuration
No specific Zabbix configuration is required.
Macros used
This macro is used in Network interface discovery. Can be overridden on the host or linked template level.
This macro is used in Network interface discovery. Can be overridden on the host or linked template level.
This macro is used in Network interface discovery. Can be overridden on the host or linked template level.
This macro is used in Network interface discovery. Can be overridden on the host or linked template level.
This macro is used in Network interface discovery. Can be overridden on the host or linked template level.
This macro is used in Network interface discovery. Can be overridden on the host or linked template level.
wmi.getall[root\cimv2,»select Name,Description,NetConnectionID,Speed,AdapterTypeId,NetConnectionStatus from win32_networkadapter where PhysicalAdapter=True and NetConnectionStatus>0″]
Triggers
Name
Description
Expression
Severity
Dependencies and additional info
Interface <#IFNAME>(<#IFALIAS>): High bandwidth usage (> <$IF.UTIL.MAX:"<#IFNAME>«>% )
The network interface utilization is close to its estimated maximum bandwidth.
(«].avg(15m)>>(<$IF.UTIL.MAX:"<#IFNAME>«>/100)*«].last()> or «].avg(15m)>>(<$IF.UTIL.MAX:"<#IFNAME>«>/100)*«].last()>) and «].last()>>0
«].avg(15m)>
WARNING
Manual close: YES
Depends on:
Interface <#IFNAME>(<#IFALIAS>): High error rate (> <$IF.ERRORS.WARN:"<#IFNAME>«> for 5m)
Recovers when below 80% of <$IF.ERRORS.WARN:"<#IFNAME>«> threshold
«,errors].min(5m)>><$IF.ERRORS.WARN:"<#IFNAME>«> or «,errors].min(5m)>><$IF.ERRORS.WARN:"<#IFNAME>«>
«,errors].max(5m)>
WARNING
Manual close: YES
Depends on:
Interface <#IFNAME>(<#IFALIAS>): Ethernet has changed to lower speed than it was before
This Ethernet connection has transitioned down from its known maximum speed. This might be a sign of autonegotiation issues. Ack to close.
Manual close: YES
Depends on:
This trigger expression works as follows:
1. Can be triggered if operations status is down.
2. <$IFCONTROL:\"<#IFNAME>\»>=1 — user can redefine Context macro to value — 0. That marks this interface as not important.
No new trigger will be fired if this interface is down.
3. =1) — trigger fires only if operational status is different from Connected(2).
WARNING: if closed manually — won’t fire again on next poll, because of .diff.
<$IFCONTROL:"<#IFNAME>«>=1 and («].last()><>2 and «].diff()>=1)
«].last()>=2 or <$IFCONTROL:"<#IFNAME>«>=0
AVERAGE
Manual close: YES
Feedback
Please report any issues with the template at https://support.zabbix.com
Windows services by Zabbix agent active
Overview
For Zabbix version: 5.4 and higher Special version of services template that is required for Windows OS.
Setup
Refer to the vendor documentation.
Zabbix configuration
No specific Zabbix configuration is required.
Macros used
This macro is used in Service discovery. Can be overridden on the host or linked template level.
This macro is used in Service discovery. Can be overridden on the host or linked template level.
This macro is used in Service discovery. Can be overridden on the host or linked template level.
This macro is used in Service discovery. Can be overridden on the host or linked template level.
^manual|disabled$
Template links
There are no template links in this template.
Discovery rules
Name
Description
Type
Key and additional info
Windows services discovery
Discovery of Windows services of different types as defined in template’s macros.
ZABBIX_ACTIVE
service.discovery
Filter:
Items collected
Group
Name
Description
Type
Key and additional info
Services
State of service «<#SERVICE.NAME>» (<#SERVICE.DISPLAYNAME>)
ZABBIX_ACTIVE
service.info[«<#SERVICE.NAME>«,state]
Triggers
Name
Description
Expression
Severity
Dependencies and additional info
«<#SERVICE.NAME>» (<#SERVICE.DISPLAYNAME>) is not running (startup type <#SERVICE.STARTUPNAME>)
The service has a state other than «Running» for the last three times.
«,state].min(#3)><>0
AVERAGE
Feedback
Please report any issues with the template at https://support.zabbix.com
Windows by Zabbix agent active
Overview
For Zabbix version: 5.4 and higher New official Windows template. Requires agent of Zabbix 4.4 and newer.
This template was tested on:
Windows, version 7 and newer.
Windows Server, version 2008 R2 and newer.
Setup
Install Zabbix agent on Windows OS according to Zabbix documentation.
Zabbix configuration
No specific Zabbix configuration is required.
Template links
Name
Windows CPU by Zabbix agent active
Windows filesystems by Zabbix agent active
Windows generic by Zabbix agent active
Windows memory by Zabbix agent active
Windows network by Zabbix agent active
Windows physical disks by Zabbix agent active
Windows services by Zabbix agent active
Zabbix agent
Discovery rules
Items collected
Group
Name
Description
Type
Key and additional info
Triggers
Name
Description
Expression
Severity
Dependencies and additional info
Feedback
Please report any issues with the template at https://support.zabbix.com
You can also provide a feedback, discuss the template or ask for help with it at ZABBIX forums.
Windows SNMP
Overview
For Zabbix version: 5.2 and higher
Setup
Refer to the vendor documentation.
Zabbix configuration
No specific Zabbix configuration is required.
Template links
Name
Generic SNMP
HOST-RESOURCES-MIB SNMP
Interfaces Windows SNMP
Discovery rules
Items collected
Group
Name
Description
Type
Key and additional info
Triggers
Name
Description
Expression
Severity
Dependencies and additional info
Feedback
Please report any issues with the template at https://support.zabbix.com
Known Issues
Description: Doesn’t support In/Out 64 bit counters even though IfxTable is present: Currently, Windows gets it’s interface status from MIB-2. Since these 64bit SNMP counters (ifHCInOctets, ifHCOutOctets, etc.) are defined as an extension to IF-MIB, Microsoft has not implemented it. https://social.technet.microsoft.com/Forums/windowsserver/en-US/07b62ff0-94f6-40ca-a99d-d129c1b33d70/windows-2008-r2-snmp-64bit-counters-support?forum=winservergen